Monitoring Status and Performance : About Reports

About Reports
This section discusses types of reports and understanding traffic direction.
Types of Reports
Reports and statistics help you bracket a problem, question, or analysis. The Orchestrator’s collections of reports basically fall into two broad categories:
n
Statistics related to network performance and application performance. These provide visibility into the network, enabling you to investigate problems, and address trends, and evaluate your WAN utilization.
n
Reports related to status of the network and appliances. For example, alarms, threshold crossing alerts, reachability between the Orchestrator and appliances, scheduled jobs, etc.
Interpreting Charts
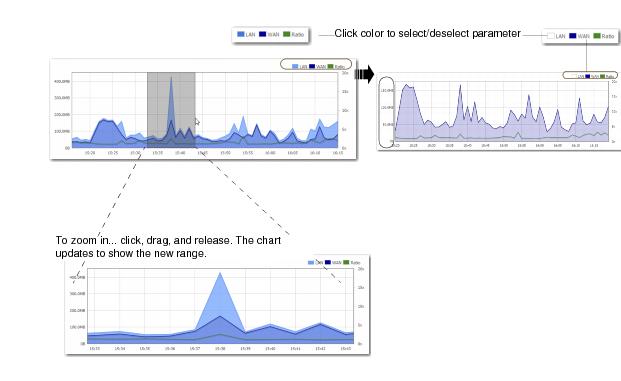
Some charts feature spark lines, as well as selectable (and modifiable) time ranges for collected data. Others show data in a bar chart format.
Line Charts
Line charts consist of filters, chart displays, and a modifiable time range area.
 
Bar Charts
For each direction of traffic — inbound and outbound — the overlapping bars are paired to show the full volume of traffic and the reduced, optimized size of the same traffic.

Please send comments or suggestions regarding user documentation to techpubs@silver-peak.com.