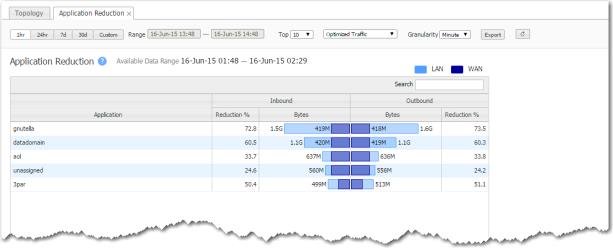
The Application Reduction chart shows which applications have sent the most bytes.
 |
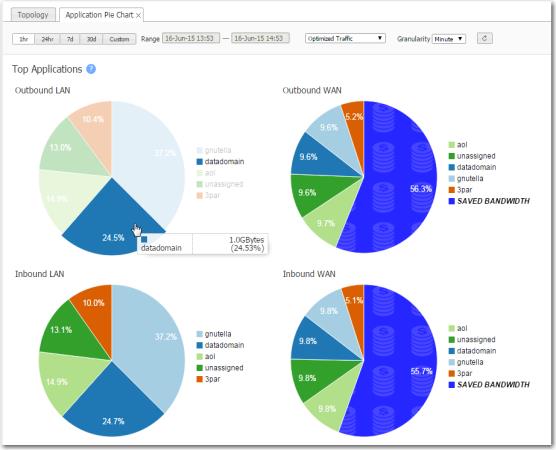
The Application Pie Charts show what proportion of the bytes an application consumes on the LAN and on the WAN.
 |
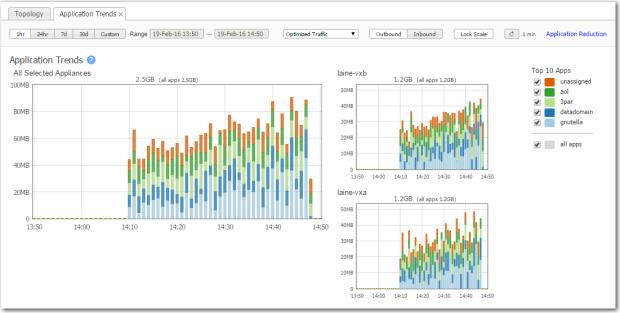
The Application Trends chart answers the following questions:
 |
Note  When it comes to flow and application statistics reports, user-defined applications are always checked before built-in applications.
Ports are unique. If a port or a range includes a built-in port, then the custom application is the one that lays claim to it.
If two distinctly named user-defined applications have a port number in common, then report results will be skewed, depending on the priority assigned to the custom applications. A port is only counted once.
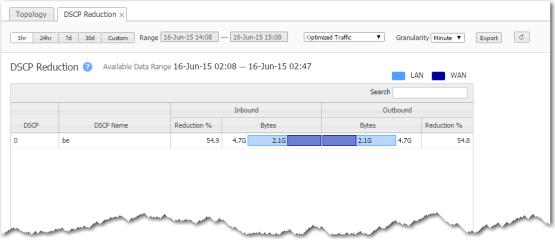
The DSCP Reduction chart shows which DSCP classes are sending the most data.
 |
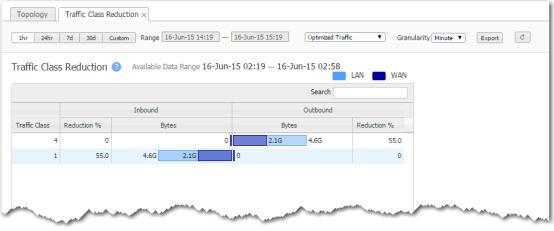
The Traffic Class Reduction chart shows which applications have sent the most bytes.
 |